
Release judgment criteria・Estimate how many potential bugs remain

- 1. Software quality is determined by the number of potential bugs
- 2. Potential bugs have still been found, so there is no choice but to estimate
- 3. I want a more convincing explanation for potential bugs
- 4. What is the bug growth curve?
- 5. I don’t understand …
- 6. So what do you read from the reliability growth curve?
- 7. Is the reliability growth curve credible?
Software quality is determined by the number of potential bugs
So far, I’ve written about existing bugs I found in my tests . By the way, what is the most important thing when judging the quality of the source code that needs to be checked at the time of release judgment based on the number and contents of bugs ? I feel like I’ve forgotten something. .. .. Yes, how many potential bugs remain that have not yet been found in the test, rather than the bugs found in the test, to determine the quality of the software ? But, in fact, it is the most important thing.
If there are no potential bugs left in the software, the quality is 100 points . But, even if how much design reviews and test Unfortunately, the potential to have bugs zero the fact that it can not be proven . Still or potential bugs that have not been discovered there is review what, determine to anyone not found because. No one can count the things you haven’t found as one or two.
Potential bugs have still been found, so there is no choice but to estimate
So what are you thinking about so far? I feel like that. In fact, the activities that have been considered so far all, still find and not latent is standing bug estimate how many stars there 's the collection of information for. No one really knows how many more potential bugs we haven’t found yet.
What we can do is collect as much information as possible about how many bugs we have already found, what tests we found them, what the quantity and quality of those tests are, and the information we have collected in various pasts. In comparison with experience, it is estimated that there are probably few potential bugs that have not been found yet because we have found enough bugs .
Only then can you believe that there are few potential bugs left before you can decide that you can release the software .
I want a more convincing explanation for potential bugs
But with this alone, it’s just that there shouldn’t be any bugs left because I’ve done a lot of testing, so it’s not convincing . Well, it doesn’t matter because you don’t need that much persuasiveness when deciding on a software release .
However, externally the the quality situation when describing Toka, in-house management layer quality situation to when describing the Toka is, say a little more brackets, something seems theoretically , when the potential bug I do not anymore almost left I want a way to say that.
And a convenient way to use it in such cases is the old bug curve . Bug growth curve Toka reliability growth curve Toka, Gonberutsu curve Toka logistic curve Toka, because you may be referred to by various names, I think that there is that everyone is also once heard.
It is often introduced as a tool used to judge the end of software testing ( judgment of whether it is okay to finish the test because it has already been tested sufficiently). This is an S-shaped curve, I think you’ve seen it. In this article, we will use the name Bug Growth Curve.
Gombelz curve / logistic curve
What is the bug growth curve?
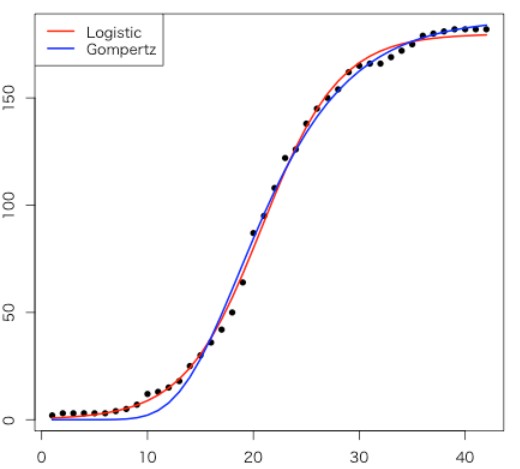
In the graph above, the blue line is the Gombelz curve and the red line is the logistic curve. But with this alone , I don’t know how to use it to determine how many potential bugs remain . Before that, let’s sort out the relationship between words.
Gombelz curve or logistic curve is a name given to mean a curve drawn by Gombelz function or logistic function, which is a mathematical function that draws an S-shaped curve when drawn on a graph .
On the other hand, the biological populations and bug discovery number when you try to Te software such as, first, to slow the increase, and how, such as last also increase becomes less increased sharply increase in the middle. If you graph the increase status with time on the horizontal axis and cumulative amount on the vertical axis, you will get an S-shaped graph . This is called the growth curve .
More specifically, if you draw a graph with the horizontal axis as the amount of tests (number of tests, man-hours for test work, etc.) and the cumulative number of bugs found on the vertical axis , this is a bug. It is called a growth curve or reliability growth curve . The bug growth curve is sometimes called the bug curve for short. The word “reliability" means that the fewer bugs there are, the higher the reliability of the software, so think of the number of bugs as reliability and the general term .
And, experience shows that the bug growth curve of soft air often overlaps with the Gombelz curve and the logistic curve , according to the observation results of many software development projects. I don’t know the theory as to why this happens, but it is the wisdom of our ancestors that it would be safe to make such a judgment based on a lot of experience .
Therefore, it is common to draw a Gombelz curve or a logistic curve by superimposing it on the bug growth curve drawn based on the actual value . I’ll explain why you do that later.
To summarize, both the bug curve and the reliability growth curve are one type of growth curve . This growth curve often overlaps with the Gomberts and logistic curves. So, when you draw a bug curves and reliability growth curve based on the actual value,併to the actual value wrote there be Gonberutsu curve is drawn, and Gonberutsu curve as a whole at that time called there also. If the curve to be written together is a logistic curve, it may be called a logistic curve as a whole .
I don’t understand …
Yes, I’m saying something like that, if you were an old man, you would be deceived by a fox . Let’s take a look at a more concrete example. This is the output screen of the software tool that draws the reliability growth curve used by my father Gutara .
Confidence growth curve generation tool
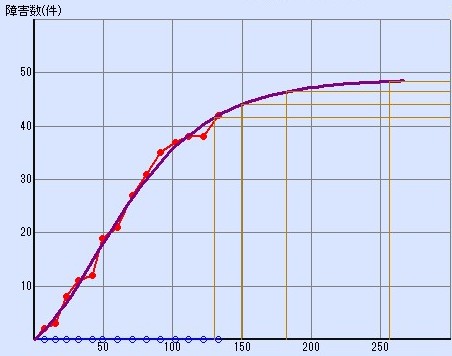
If you enter the daily test man-hours (man-days) and the number of detected bugs , the growth curve with the test man-hours on the horizontal axis and the cumulative number of bugs on the vertical axis will be displayed as a graph.
The red point of the graph is the actual value actually entered , and the purple curve is the graph in which the growth degree curve is applied to the red point of the actual result . In other words, such as Gonberutsu function Toka logistic function mathematical function , and the value of the actual adjusting the various parameters of the function as along with, it relies on the curve was fit is a curve of purple.
So what do you read from the reliability growth curve?
What can we see from this graph ? The rightmost end of the red achievement value is the latest status at this point . In the case of this graph, the test man-hour is 130 (man-day) and the cumulative number of bugs is 42. Up to this point, since it is just an actual value, it is known as a fact even if there is no reliability growth curve.
So what does the future part of the current situation, on the right side of the red dot of the achievement, indicate? For example, when the test man-hour is around 200 (man-day) , the cumulative number of bugs is 47 , and the graph is quite horizontal. When the test man-hour is around 250 (man-day) , the cumulative number of bugs is 48 and the curve is almost horizontal, so it seems that no more bugs will be found.
The part to the right of this latest situation is the value that will be like this if you apply the growth curve to the actual value . Since the software bug growth curve often overlaps with the Gombelz curve and logistic curve, it is estimated that the number of detected bugs in the future part to the right of the actual value will probably overlap with this curve .
As a result of the estimation, if the test is performed until the test man-hour reaches 250 (man-day) , it is considered that all the bugs that can be found have been found . In other words, where the test may be done to the ne it can determine. At 200 (man-day) testing, you may still find another bug. Testing is expensive and time consuming, so it’s a difficult time to decide whether to continue or stop here.
You can also see this graph from a different perspective . We have found 42 bugs in the latest situation , but we can estimate that if we continue testing, we will find 6 more potential bugs that have not been found yet . In other words, it can be estimated that the current software will have 6 potential bugs that have not yet been found .
Is the reliability growth curve credible?
I’ve written something like that, but is the estimation of potential bugs using the reliability growth curve credible in the first place? Unfortunately there is no proof that you can trust it. There is no proof, but Father Gutara has used this confidence growth curve for many years as information for software release decisions. In the next article, I’ll share with you my father Gutara’s thoughts on why he’s used the confidence growth curve.