
Two concrete examples of quantitatively managing the progress of software development and testing

- 1. Process progress management is important in software development and testing
- 2. Process progress management includes schedule progress management and product progress management.
- 3. Specific example of schedule progress management (sample example using software test)
- 4. Qualitatively represent the progress of the schedule using the completion rate of milestones
- 5. If you want to match the substance more, you can reflect the amount of work.
- 6. Specific example (sample) of the plan for managing the progress of deliverables in software tests
- 7. Specific example (sample) of achievements in managing the progress of deliverables in software tests
- 8. Create a mechanism at the beginning of development so that actual values are automatically collected
- 9. Achieve and aim for goals with regular monitoring and feedback
Process progress management is important in software development and testing
Software development and testing are not as visible as hardware development and manufacturing, so you can’t achieve your plans without good management. In software development and testing, it is important to manage the progress of processes that directly affect the release schedule , as well as cost control and quality control . It is sometimes abbreviated as process management , but in this article it will be called process progress supervision.
Since it is management , the purpose is to achieve the original plan by going through a management cycle of (1) making a plan , (2) monitoring the implementation status, and (3) correcting any deviations from the plan . Quantitative metrics (evaluation methods and values) that are easy to monitor are needed to achieve the objectives . In this article, I will introduce the progress management of the process that can be used in software development and testing, using a little concrete example based on the experience of my father Gutara.
Process progress management includes schedule progress management and product progress management.
Process progress management can be broadly divided into schedule progress management and deliverable progress management . Schedule progress management is the management of whether development and testing work is proceeding according to the originally planned schedule without delay . The ultimate goal of the software development schedule is to keep the software release date, but if the progress management of the schedule is not done well, the software will not be completed and can not be released even on the release date. A sad situation can occur.
Deliverable progress management means design documents, source code, execution code, etc. for software development, test procedure manuals, test results, detection bugs, etc. for tests, and the deliverables of development work and test work are as originally planned. It is the management of whether it is done or not. Again, the ultimate goal is to complete the deliverables needed when the software is released, but if the progress of the deliverables is not well managed, the test results will not be available even on the release date. It is possible that the release is not possible.
Progress management of the progress management also artifacts of dates also, but in the end I originally planned to release date of the software is good at it if it can be achieved, it was not able to become a release date out of hand in There is no way. Therefore, it is important to manage the progress in the process by dividing the software development and testing period into several parts , monitoring the achievement status of intermediate goals and taking countermeasures in the middle of development and testing .
Specific example of schedule progress management (sample example using software test)
Let’s take a closer look at how to manage the progress of the schedule. The following is a sample management table that manages the progress of the schedule using the software test process as an example . I will introduce the progress management of the schedule using this sample.
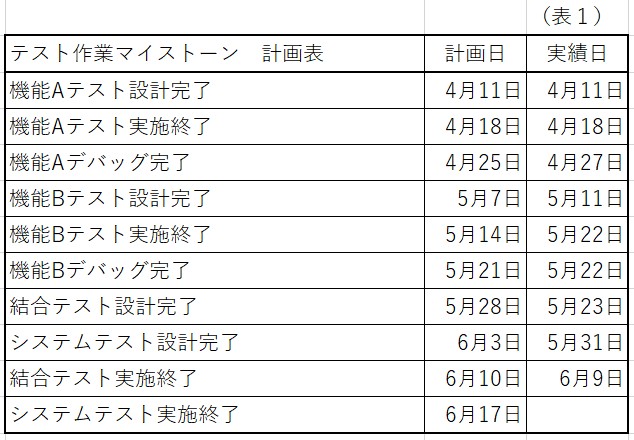
Table 1 is a schedule table created at the test planning stage . Each line has a subdivided test work written out. In the column of the second row of the plan date, each of the work is completed or terminated plan date will is written. The date of completion or completion of such work is sometimes used as a milestone of work, so it can also be called a milestone plan . This is the content to be filled in at the test planning stage.
In the actual date on the right side of the planned date , write the date when the test work written in each line was actually completed or completed . This can be easily done by writing the date in Table 1 on the completion date of the work. The sample assumes that the current date is June 15th, and it is written that the integration test, which was planned to end on June 10th, ended on June 9th, one day earlier than planned.
From this Table 1 alone, it is qualitatively clear whether the schedule is delayed or advanced, but since it is not quantitative, it can be used as a management trigger to “take measures because there is a problem with progress". It’s a little difficult to use.
Qualitatively represent the progress of the schedule using the completion rate of milestones
Now, let’s devise a way to qualitatively express the progress management of the schedule based on the information of the plan and actual results in Table 1. There are many ways to do this, but the easiest is the milestone completion rate . With each planned date in Table 1 as the milestone to complete the work, calculate what percentage of the milestones were implemented by the planned date on the monitoring date. Written in an expression, it looks like this:
Milestone completion rate (%)
= (Number of milestones completed by the planned date * 100) /
Number of milestones planned to be completed by the day
If this is calculated and displayed once a week, it will be as shown in Table 2. (Currently assumed to be June 15th)
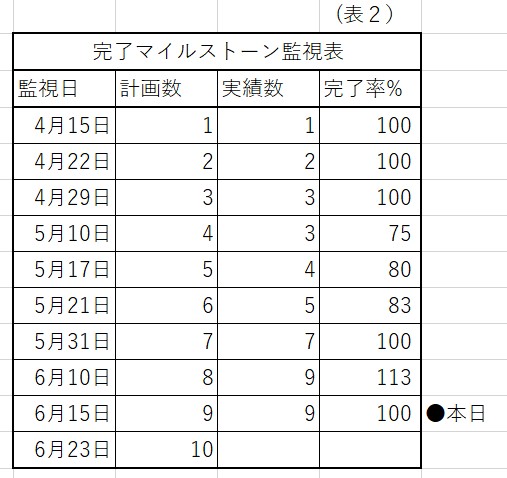
In the example in Table 2, as of April 29, the number of milestones planned to be completed by this date is 3, and the number of milestones actually completed is 3, so the completion rate is 100%. is. (The number is counted by looking at Table 1)
But on May 10 at the time of, in because the number that had been planned is not yet complete function B test designed for 4 (was completed May 11, 2008), a track record number 3 is the completion rate of 75 It has dropped to % . After that, the completion rate was less than 100% until May 21, but recovered to 113% on June 10, which was ahead of the plan, and returned to 100% as planned by June 15 . ..
You can’t tell what actually happened just by looking at the completion rate numbers, but it may be that test B was unexpectedly difficult and it took more man-hours to design and implement the test than planned. And maybe he called in a helper from another test team to make up for this delay . Regardless of the inside situation, it is easy to manage if you monitor the process progress with the qualitative metric of milestone completion rate . For example, if the completion rate drops below 70%, it becomes clear that management triggers such as determining that an important problem may have occurred , confirming a specific problem, and proceeding with countermeasures. In management, it is very important to investigate and determine the need for countermeasures, so it is useful to have metrics that can quantify even such simple things.
If you want to match the substance more, you can reflect the amount of work.
In Table 2, the achievement rate was calculated based on the number of milestones achieved . If all the milestones are just as important, that’s fine, but if not, a little ingenuity will give you a closer sense of actual progress .
For example, suppose that the test man-hour required for the function A test is 5 man-days and the test man-hour required for the function B test is 20 man-days. Function B requires four times as many man-hours as function A, but the plan to complete the work for both function A and function B in the same period is that the number of personnel put into the test of function B is four times that of function A.
This means that function B is four times more important than function A in terms of maintaining milestones . Then, when calculating the achievement rate of the milestone, function A multiplies the man-hour coefficient 1 and function B multiplies the man-hour coefficient 4 to calculate the achievement rate, and incorporates the importance of maintaining the milestone by the test man-hours. You can also do things.
By multiplying the basic milestones in Table 1 by some factor of importance as needed, it is possible to get a better sense of progress, so consider according to each test project. I think that is also good.
Specific example (sample) of the plan for managing the progress of deliverables in software tests
Next, I will introduce the progress management of deliverables a little more concretely using a sample of the test process.
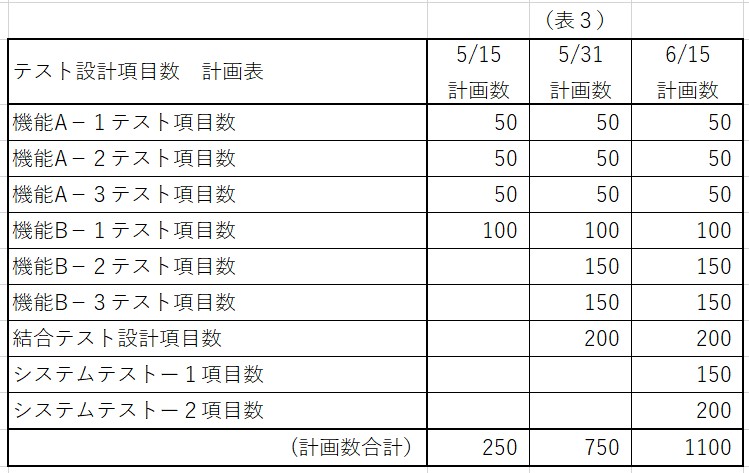
Table 3 is a plan table of deliverables created at the test planning stage using the number of test items as an example . Each line shows the number of test items for each subdivided test . In the column of the number of plans in the 2nd to 4th columns, the number of test items scheduled to be completed by each schedule is written (blank column is zero).
This is the content to be filled in at the test planning stage. Unlike the schedule progress management table, there is no column for entering the results in this plan table. Use another table to fill in the achievements.
Specific example (sample) of achievements in managing the progress of deliverables in software tests
Table 4 shows the actual results corresponding to the plan table in Table 3. The vertical direction is almost the same as Table 3, but (total) and completion rate rows are added at the bottom of the table . The column direction has the same date as the planned date, but this is the date to monitor the actual performance . The actual number of completed test items as of this date is written in Table 4.
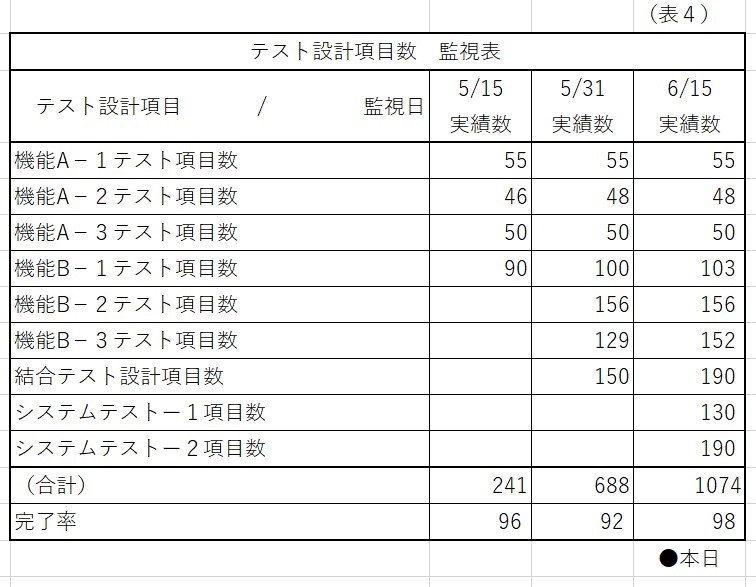
Since the (Total) column is the total in the vertical direction, enter the total number of completed test items when the actual results are confirmed . The completion rate is then calculated as the total number of completed achievements relative to the total planned number of test items as of the monitoring date . The formula is as follows.
Test completion rate (%) in XX days
= (Total number of test items completed by XX days * 100) /
Total number of test items planned to be completed by XX days
For example, in the example of Table 4 , the total number of completed test items planned as of May 31 is from Table 3 to 750 , and the total number of actually completed test items is from Table 4 to 688, so it is completed. The rate = 688 * 100/750 = 92%. Assuming today is June 15, the completion rate of test items dropped to 92% on May 31st, but has recovered to 98% as of today, as can be seen from Table 4. ..
In this example, there was the youngest child to use the number of test items as artifacts, software development and growth of the test that can count can be used to progress the management of metrics by the product in the same way if the fruit. At the design stage, you can use the number of pages in the design document, the number of design reviews, the point rate of design reviews, and so on. At the implementation stage, you can use the number of lines of source code created / modified and the number of times code reviews are performed. At the test design stage, you can also use the number of test design items, the number of actual test items, the number of test reviews, and the number of bugs found in the test. I think it is better to use the metrics as needed at each stage from software development to testing .
Create a mechanism at the beginning of development so that actual values are automatically collected
In this way, there are two types of process progress management: schedule progress management and product progress management , but both of them collect actual values by collecting actual results and finding deviations from the plan , which leads to management. I need a thing. The mechanism for collecting actual values will not be collected well unless a mechanism is created to automatically accumulate actual values in daily work when software development and testing are planned . For example, at the end of each day’s work, it is essential to record the amount of deliverables of the day, and it is essential to check the status of the record once a week.
Achieve and aim for goals with regular monitoring and feedback
Then, when the results are gathered, be sure to compare it with the value of the plan on a regular basis, and when the deviation from the plan becomes larger than a certain level, give feedback that measures to recover the deviation will be considered and implemented. You should try to maintain your original plan by doing so. This feedback is the most important thing in management, so don’t forget it.
And, even if the feedback shift can not be recovered from the plan and sometimes a total review of the image itself and, actually put in view of the fact that modify the achievable plan, it is also important to think about the measures.